Showing posts with label graphics. Show all posts

Wednesday, January 21, 2009

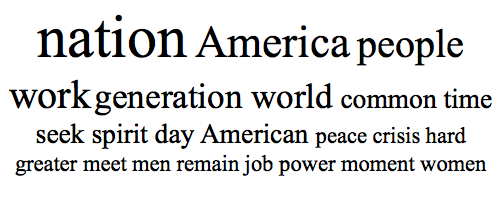
Tomographic View of Every Single Presidential Inaugural Address

Women-usage.png
Again, hats off to the New York Times, who posted yet another great interactive graphic. This one allows you to scroll through every U. S. presidential inaugural address since George Washington and see the most-used words in that speech.

This view of these speeches gives me the same feeling I get when I "slice" up a patient with CT or MR, and take a real-time stroll through their body from different angles. This Times chart gives a fascinating overview of the events of the times faced by each president, as echoed in their address. It also lets one to instantly dive down into the context of a given speech to see how a particular word was used.

For example, the word "women" was used more than twice in only 4 of the inaugural addresses in the past 100 years: by presidents Wilson, FDR, Bush-1 and Obama.

Wilson, FDR and Obama used the word respectively 4, 3 and 4 times, and then only in the context of the phrase "men and women". Bush-1 used "women" four times, and is the only president to have singled out the word "women" twice:
...There are young women to be helped who are about to become mothers of children they can't care for and might not love.

... who will throw a salute by himself when the flag goes by, and the women who will tell her sons the words of the battle hymns.
It must have taken the graphics gremlins at the Times a ton of time to create this Flash-based graphic. However, it seems like the process should lend itself to automation.

I'd love to have a generalized software tool that would allow me to grab multiple text and images sources and create an instant interactive concordance like this excellent Times graphic. Such a program could be an amazing tool for education. Any developers listening out there?

Monday, March 3, 2008

National Museum of Health and Medicine Images Online

If you just stick to the Capitol Mall on visits to Washington D. C., you will probably never end up at the wonderful National Museum of Health and Medicine. If so, you'll end up missing out on an awesome and ginormous collection of historically and medically fascinating items. This museum was founded as the Army Medical Museum in 1862, and their collection now includes over 24 million items.
Skull radiograph above shows a 0.50 caliber bullet wound of the face. Injured while heating 0.50 caliber incendiary m.g. [?] bullet with a blowtorch while manufacturing an ash tray. Entrance just below right eyebrow. 11 days after injury, patient began hemorrhaging; blood flow so profuse it was impossible to carry out emergency procedures. Patient deceased. World War 2.


"Crossing your fingers" won't prevent venereal disease but a prophylaxis will. Venereal Disease Control Office, L.J. Stephens, Captain, Medical Corps, Jefferson Barracks, M.O.
As part of my radiology training, I got to spend 6 weeks at the AFIP course in radiologic pathology. Since the NMHM and AFIP shared the same building at the time, I spent a lot of my spare time wandering through the NMHM exhibits. Some of my favorites: bits of Abraham Lincoln's skull, President Garfield's assassin's spleen, an isolated humerus with flagrant osteomyelitis from a Civil War minnie ball wound, hand-written medical texts by Viet Cong medics, and artwork signed by a young Army physician: Captain Frank Netter, M.D.


It's great news to hear that the NMHM has been uploading their pictures to Flickr since September 2006, under a very liberal Creative Commons license. This is a great public domain resource for medical bloggers or anyone else interested in the history of medicine.


General Daniel Sickles' leg bones
, removed after the Battle of Gettysburg during the Civil War.
Check out the following links to some of their images on Flickr at:

Otisarchives1
Otisarchives2
Otisarchives3


Other excellent images can be seen online at the Otis Archives Gallery.

(via Morbid Anatomy)

Wednesday, February 27, 2008

Take the First Chernoff on the Left

There is no topic, no matter how intrinsically tedious or boring, that cannot be made even more tedious and boring with the right set of Bad Powerpoint Slides.
The converse is also true -- a few engaging images can make even a fairly mundane topic sing and dance. Radiology lectures are an obvious exemplar of this, being filled with lots of fascinating images. However, what if you need to present a ton of data? If so, beware -- your task will be a mighty one. Decades of punitive Powerpoints have pretty well proven that any slide with a big table of data is going to have an LD50 of under 30 seconds.

A lot of creativity has gone into solving this problem. One intriguing method was proposed by Herman Chernoff back in 1973 in his paper: "The Use of Faces to Represent Points in k-Dimensional Space Graphically", Journal of the American Statistical Association 1973;68:361-368.

Chernoff's proposal relies on the notion that the human eye-brain combination is one of the most powerful pattern-recognition engines on the planet. If one is trying to convey a large multidimensional table of numbers, he suggested representing each observation as a computer-drawn cartoon of a human face,
...whose features, such as length of nose and curvature of mouth, correspond to components of the point. Thus every multivariate observation is visualized as a computer-drawn face. This presentation makes it easy for the human mind to grasp many of the essential regularities and irregularities present in the data.
For example, consider the following table of totally bogus data that I made up just now, all by myself. It purports to show income level, quality of life and onerousness of call for 4 physician specialties.

  Income Quality of Life Onerousness of Call
Radiology Medium High Medium
Pediatrics Low Medium Low
Family Practice Low Medium High
Surgery High Low High

Yep, this table is a real dozer, all right. But wait! What if we represent the same data as Chernoff faces? To do this, I fired up my copy of Mathematica and used it to run some sample code I downloaded from the Mathworld site (R enthusiasts see here for sample code). In the plot below, the shape of the eyes, mouth and head respectively represent income, quality of life and onerousness of call. My fabricated data now looks something like this:

Of course, this kind of plot has certain potential flaws. As K. S. Park points out:
A major drawback of Chernoff faces is that the subjective assignment of facial expressions to variables affects on the shape of the face.
No feces, Conan-Doyle character. My fabricated and highly biased data, coupled with an equally biased assignment of facial features, makes that first Chernoff on the left look pretty darned appealing, doesn't it?

A discussion of Chernoff faces wouldn't be complete mentioning the work of Eugene Turner, particularly his prize-winning map titled Life in Los Angeles. He has this to say about it:
I compiled and designed this map which was drafted by Richard Doss. It was an idea based on Chernoff faces. It is probably one of the most interesting maps I've created because the expressions evoke an emotional association with the data. Some people don't like that.
Here's one final fun example from the world of baseball: Alex Reisner's What's the Matter with Chernoff Faces, illustrated by his plot of the 2005 National League season. I especially enjoyed the alternative system he suggests there: Reisner faces.


Update, 2/28/08:   I realize that I sort of left things hanging here, with no final socko conclusion rendered on the utility of Chernoff faces.  This is probably because I still don't have a strong opinion.  However, now that I have the machinery to plot these faces, I'll look for ways to apply them to real data and see how they work for me.  My goal is to avoid using them like the person in Andrew Lang's quote, who
...uses statistics as a drunken man uses lamp-posts -- for support rather than illumination.
Monday, February 25, 2008

Graph Fu

See this stunning Flash-based plot on the NY Times site, showing movie box office receipts over time. (via Daring Fireball)

Giving presentations is a big part of the life-blood of academic radiology. Therefore, I'm always looking for cooler and more effective ways of presenting information.

After seeing this lovely Times plot, I'll have to see if I can't convince R, my favorite stat environment, to make some similar plots of my data.
-----------

Update:  For those geeky enough to care, someone else has already worked out how to make R do a very similar plot.